SCENARIO 14-17
Given below are results from the regression analysis where the dependent variable is the number of
weeks a worker is unemployed due to a layoff (Unemploy) and the independent variables are the age
of the worker (Age) and a dummy variable for management position (Manager: 1 = yes, 0 = no).
The results of the regression analysis are given below:
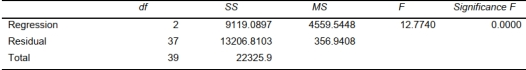
-Referring to Scenario 14-17, the null hypothesis implies that the number of
weeks a worker is unemployed due to a layoff is not related to one of the explanatory variables.
Definitions:
Piecework
A payment method based on the amount of work completed rather than the time taken, frequently used in manufacturing and agriculture.
Variable Pay
A compensation strategy that ties employee pay directly to their performance or achievements, often including bonuses, commissions, and profit-sharing plans.
Competitiveness
The ability of a company or country to maintain and gain market share by producing goods or services more effectively than competitors.
Union Power
The collective strength and influence a group of workers has through their union, often used to negotiate working conditions and wages.
Q16: Referring to Scenario 12-9, at 5% level
Q55: Referring to Scenario 14-4, what is the
Q63: Referring to Scenario 12-3, the null hypothesis
Q80: In a multiple regression model, the
Q117: Referring to Scenario 14-15, what is the
Q145: Referring to Scenario 12-1, the company tests
Q162: Referring to Scenario 16-15-B, you can reject
Q191: If a categorical independent variable contains 4
Q204: Referring to Scenario 16-15-A, what is the
Q356: The coefficient of multiple determination measures the