A fast food chain test marketing a new sandwich chose 18 of its stores in one major metropolitan area. Nine of the stores were in malls and nine were free standing. The sandwich was offered at three different introductory prices. The table shows the number of new sandwiches sold at each location for each location type and price combination. 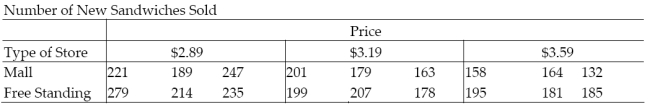 a. Write a model for the mean number of sandwiches sold, E(y), assuming that the relationship between E(y) and price, x1, is first-order. b. Fit the model to the data. c. Write the prediction equations for mall and free-standing stores. d. Do the data provide sufficient evidence that the change in number of sandwiches sold with respect to price is different for mall and free-standing stores? Use α = .01. 12.9 Comparing Nested Models (Optional) 1 Conduct Test to Compare Complete and Reduced Models
Definitions:
Zero
A number representing the absence of any quantity or measure; it is a fundamental concept in mathematics and sciences.
Positive
Referring to a condition or quantity that is more than zero, often associated with good or desirable outcomes.
Negative
A term often used to describe a decrease, a downward trend, or harmful effects in various contexts, including finance, health, and environmental studies.
Straight Line
In mathematics and geometry, the shortest path between two points without any curvature.
Q20: In a controlled laboratory environment, a
Q21: Use the appropriate table to find
Q23: The data for a random sample
Q34: A coffeehouse wishes to see if
Q51: The contingency table below shows the
Q52: A teacher finds that final grades
Q60: A county real estate appraiser wants
Q82: Two surgical procedures are widely used
Q147: As a general rule, one can use
Q206: Referring to Scenario 11-12, what is