Multiple Choice
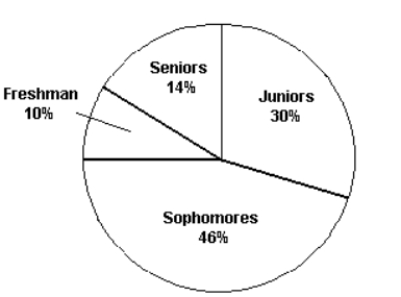 The pie chart shows the classifications of students in a statistics class. What percentage of the class consists of freshman, sophomores, and juniors?
Definitions:
Related Questions
Q13: <span class="ql-formula" data-value="\left( \begin{array} { c }
Q33: You toss one coin and one
Q35: According to a published study, 1 in
Q38: Suppose that for a certain experiment P(A)
Q48: The manager of a car dealership records
Q61: Compute <span class="ql-formula" data-value="\left( \begin{array}
Q68: The hypergeometric random variable x counts the
Q95: A recent study suggested that 70% of
Q132: Compute the number of ways you can
Q339: <span class="ql-formula" data-value="\sum _ { k =