Use the figure to answer the question.
-The sales figures for the Big "D" Company are shown below in a line graph. 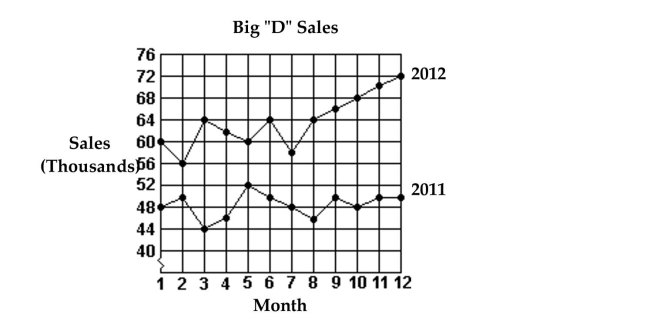 Which month in 2011 had the lowest sales?
Definitions:
Dependent Variable
The variable in an experiment or study that is affected by changes in the independent variable.
Relationship Between Variables
This concept refers to how two or more variables are connected or affect each other within a study or analysis.
Direction
In statistics, it refers to the tendency of a set of data points or a relationship between variables (e.g., positive or negative correlation).
Correlation Coefficient
A statistical measure that calculates the strength of the relationship between two variables.
Q3: A circle with diameter 24.3 ft
Q6: <span class="ql-formula" data-value="n = 12 , \bar
Q9: For what kind of triangles will the
Q11: Both SAT and ACT are well-known placement
Q12: Describe how to construct a regular octagon
Q23: A company's manufacturing process uses 500 gallons
Q24: Find the equation of the line
Q50: In the figure below, <span
Q112: A square with side lengths of
Q120: The shape of a barbecue pit