Solve the problem.
-The number of births in County A has been increasing in recent years. Use the information given in the bar graph for the years 1960 and 1990, letting x = 0 represent the year 1960 and letting y represent the number of births. Use the graph to estimate the number of births in 1965. 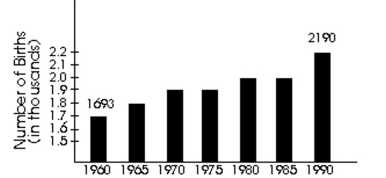
Definitions:
Q56: <span class="ql-formula" data-value="0.582"><span class="katex"><span class="katex-mathml"><math xmlns="http://www.w3.org/1998/Math/MathML"><semantics><mrow><mn>0.582</mn></mrow><annotation encoding="application/x-tex">0.582</annotation></semantics></math></span><span
Q56: If a circle is split in half
Q85: If a triangle is obtuse, then it
Q95: <span class="ql-formula" data-value="\{ x \mid x \leq
Q158: <span class="ql-formula" data-value="( \mathrm { y }
Q198: (6 + 7)- (-9 + 13)<br>A)-5<br>B)-17<br>C)9<br>D)-9
Q317: One country exported $88,100,000 more than it
Q336: <span class="ql-formula" data-value="\left( - \frac { 1
Q381: The NSC (Not So Consistent)Corporation has
Q399: <span class="ql-formula" data-value="- 4 \geq - (