Answer the question based on the given graph.
-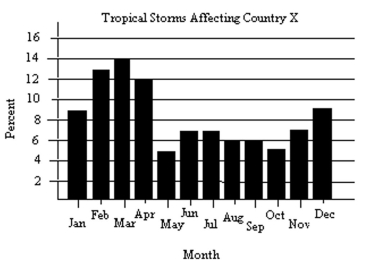
The data used to determine the graph were based on the number of tropical storms affecting Country X during the last ten years. A total of 672 tropical storms were reported. How many more tropical storms occurred during April than September? Round your answer to the nearest whole number, if necessary.
Definitions:
Productivity
The measure of efficiency of production, typically expressed as the ratio of outputs to inputs in the production process.
Domestic Residents
Individuals who live within a country and participate in its economy by working, spending, and investing there.
Role Of Government
The responsibilities and duties of government entities, including creating laws, providing social services, and ensuring economic stability.
Productivity
The measure of how efficiently inputs are converted into outputs; an increase in productivity means more output is produced with the same amount of inputs.
Q5: <span class="ql-formula" data-value="0 . \overline { 148
Q15: Police use a formula <span
Q37: 7 yards to 4 feet <br>A)
Q107: 0.00263<br>A)0.000263%<br>B)0.0263%<br>C)0.1315%<br>D)0.263%
Q119: Find the average rate of change.
Q120: If a point lies on the y-axis,
Q208: The speed of a stream is 4
Q216: -14, -2<br>A)-14<br>B)-2
Q271: <span class="ql-formula" data-value="21 \frac { 3 }
Q364: <span class="ql-formula" data-value="| - 4 | ,