Solve the problem. Round your answers to the nearest whole percent.
-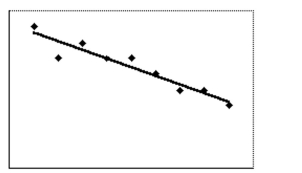 The scatter diagram shows the data for price per item (y) and the availability of that item (x) . The correlation coefficient r
Is -0.95. Determine how much of the variation in price per item can be accounted for by the best-fit line.
Definitions:
Q15: <img src="https://d2lvgg3v3hfg70.cloudfront.net/TB7023/.jpg" alt=" For a group
Q22: How many different committees can be selected
Q25: Use the table below to answer
Q45: How many triangles are in the next
Q47: Rose's work ID is based on
Q63: Two drugs, X, and Y, were
Q77: The attendance counts for this season's
Q82: <span class="ql-formula" data-value="E = 0.012"><span class="katex"><span class="katex-mathml"><math
Q96: The speed of a car in miles
Q135: <span class="ql-formula" data-value="\sqrt [ 3 ] {