Answer the question using the value of r and the given best-fit line on the scatter diagram.
-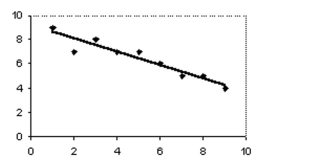 The scatter diagram and best-fit line show the data for price per item (y) and the availability of that item (x) . The correlation coefficient r is -0.95. Predict the price per item for an availability of 3.
Definitions:
Q2: Sample size = 256, sample mean =
Q23: The 6 th term of
Q26: The college daily reported: "450 students living
Q28: Construct an unbinned frequency table for
Q34: The test scores of 40 students
Q42: What is the mean of the distribution?<br>A)2500<br>B)4000<br>C)3000<br>D)2000
Q50: The mean score on the exit examination
Q55: What is the probability of getting
Q106: What is the probability that a randomly
Q210: How many ways can a president, vice-president,