Answer the question using the value of r and the given best-fit line on the scatter diagram.
-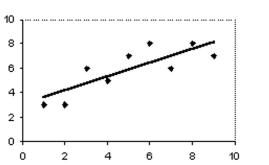 The scatter diagram and best-fit line show the data for the price of a stock (y) and U.S. employment (x) . The correlation coefficient r is 0.8. Predict the stock price for an employment value of 5.
Definitions:
Q12: A pool of possible jurors consists of
Q21: 22, 29, 21, 24, 27, 28, 25,
Q46: Construct a frequency table for the
Q47: The weights (in ounces)of 21 cookies
Q65: The histogram shows the lifespan of a
Q79: Sales of birthday cards over a one-year
Q116: Assume that a study of 500 randomly
Q128: A monthly electric bill (in dollars)<br>A)Quantitative because
Q186: Use <span class="ql-formula" data-value="S =
Q196: Consider the following counting problem. Eight women