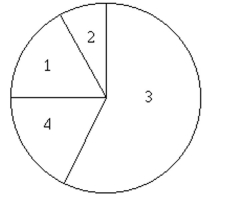
100 employees of a company are asked how they get to work and whether they work full time or part time. The figure below shows the results. If one of the 100 employees is randomly selected, find the probability that the person does not commute by public transportation. 
1. Public transportation: 6 full time, 8 part time
2. Bicycle: 5 full time, 4 part time
3. Drive alone: 26 full time, 33 part time
4. Carpool: 8 full time, 10 part time
Definitions:
Grid
A framework of spaced bars that are parallel to or cross each other; in design, a structure comprising a series of intersecting lines to help align elements.
Table
A structured arrangement of data made up of rows and columns, used to organize information.
Chart
A visual representation of data, often used in reports and presentations to illustrate statistical information through diagrams such as bar graphs, line charts, or pie charts.
SmartArt
A graphical tool included in Microsoft Office programs that enables users to create professional-quality diagrams and graphics.
Q29: Number showing when a single die is
Q34: A poll of 1000 voters in one
Q35: Find the probability of correctly answering the
Q40: Which of the following statements concerning areas
Q58: There are 2030 students in a school
Q64: The National Association of Realtors reported that
Q74: Find the next term: T, F, S,
Q95: A study of 600 college students taking
Q119: Researchers as State University conducted experiments
Q170: Three of one kind and two of