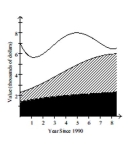
The stacked line chart shows the value of each of Danny's investments. The stacked line chart contains three regions. The uppermost unshaded region represents the value of Danny's investment in individual stocks. The center shaded region represents the value of Danny's investment in mutual funds and the bottom region in black represents the value of Danny's investment in a CD. The thickness of a region at a particular time tells you its value at that time.  Use the graph to answer the question.
-In which year was the total value of Danny's investments the greatest?
Definitions:
Continental Hot Spot
A volcanic region located in the middle of a tectonic plate where plumes of magma rise, leading to surface volcanic activity.
High Elevations
Areas of land that are significantly higher than the surrounding terrain, often leading to cooler temperatures and different ecological conditions.
Abundant Volcanism
The frequent or intense volcanic activity in a given area, leading to the formation of numerous volcanoes.
Basin
A large, bowl-shaped depression in the Earth's surface, often drained by a major river and its tributaries.
Q2: At one college, GPA's are normally distributed
Q11: A sample of 400 employees from
Q13: Among a sample of 76 students
Q14: What is the mean campus-home distance for
Q35: a. The heights of the fans at
Q51: A social studies teacher wants to know
Q74: A sample of 4 different calculators is
Q107: A polling firm, hired to estimate
Q116: After taking the first exam, 15 of
Q123: The pickup time of an answering machine