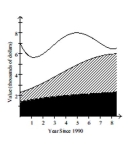
The stacked line chart shows the value of each of Danny's investments. The stacked line chart contains three regions. The uppermost unshaded region represents the value of Danny's investment in individual stocks. The center shaded region represents the value of Danny's investment in mutual funds and the bottom region in black represents the value of Danny's investment in a CD. The thickness of a region at a particular time tells you its value at that time.  Use the graph to answer the question.
-In which year was the value of Danny's investment in individual stocks the highest?
Definitions:
Compounded Monthly
Interest calculation method where the interest is added to the principal each month, and the total becomes the principal for the next calculation.
Annuity
An investment option that guarantees fixed payments over time to the holder, frequently adopted as a component of retirement planning.
Purchase Funds
Money allocated or spent for acquiring goods, services, or assets.
Compounded Quarterly
Refers to the process of applying interest to an initial amount and any accumulated interest every three months.
Q20: Sample size <span class="ql-formula" data-value="=
Q33: 1 - Kim pulled weeds at the
Q37: Responses to a survey question are
Q40: Two successive 5's are rolled with a
Q49: Use the magic penny parable to determine
Q53: Identify the utility that accounts for over
Q98: On a multiple choice test, each
Q104: Convert 0.193% to decimal form.<br>A)19.3<br>B)0.00193<br>C)1.93<br>D)0.0193
Q112: Survey responses of"good", "better", "best"<br>A)Ratio<br>B)Interval<br>C)Ordinal<br>D)Nominal
Q113: After recording delivery times for two different