The bar graph below shows the average cost of renting a studio in a certain city in each of the years 2002 through 2006. 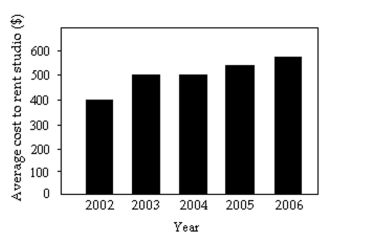
By what percentage does the average rental price increase from 2002 to 2003? Obtain a truncated version of the graph by sliding a piece of paper over the bottom portion of the graph so that the scale on the vertical axis starts at 300. In the truncated graph, by what percentage does the price appear to increase from 2002 to 2003? Why is the truncated graph misleading?
Definitions:
AVC
Average Variable Cost, which is the total variable costs (costs that change with the level of output) divided by the quantity of output produced.
Shut Down
The temporary or permanent cessation of operations, often referring to business closure due to economic events or strategic decisions.
Purely Competitive Seller
Describes a market situation where a large number of sellers offer identical products, and no single seller can influence the market price.
Product Price
The amount of money charged for a product or service, or the sum of the values that consumers exchange for the benefits of having or using the product or service.
Q10: Identify the utility that decreases as a
Q34: The scores on a certain test are
Q64: The number of people on a jury<br>A)Quantitative
Q65: The earthquake magnitude scale relates the magnitude
Q77: If a motorcycle weighs 25% less than
Q93: A medical research team studied the
Q104: Convert 0.193% to decimal form.<br>A)19.3<br>B)0.00193<br>C)1.93<br>D)0.0193
Q119: Halfway through the season, a basketball player
Q136: The finishing times for athletes running a
Q170: A T.V. show's executives raised the fee