A nurse measured the blood pressure of each person who visited her clinic. Following is a relative-frequency histogram for the systolic blood pressure readings for those people aged between 25 and 40. Use the histogram to answer the question. The blood pressure readings were given to the nearest whole number. 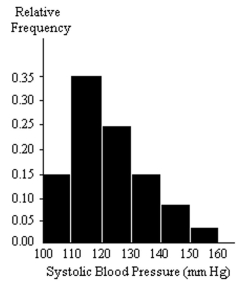
-Approximately what percentage of the people aged 25-40 had a systolic blood pressure reading between 110and 119 inclusive?
Definitions:
Histogram
A graphical representation of data using bars of different heights to show the distribution of values.
Distribution
In statistics, the pattern or spread of values taken by a particular variable, indicating how often each value occurs.
Boxplot
A graphical representation that displays the distribution of a dataset based on a five-number summary: minimum, first quartile, median, third quartile, and maximum.
Histogram
A graphical representation of the distribution of numerical data through bars of various heights.
Q17: Among a simple random sample of
Q17: A professional tennis player hit one
Q32: A report of teacher-district negotiations stated: "Of
Q37: A quality control specialist compares the output
Q63: During the month of January, the depth
Q69: Lengths of human pregnancies<br>A)Symmetric<br>B)Right-skewed<br>C)Left-skewed
Q70: A homeowner put a brand-name fertilizer/weed killer
Q74: Suppose you know that the distribution of
Q78: The following data set is the
Q81: The local Tupperware dealers earned these commissions