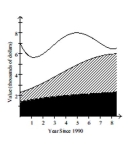
The stacked line chart shows the value of each of Danny's investments. The stacked line chart contains three regions. The uppermost unshaded region represents the value of Danny's investment in individual stocks. The center shaded region represents the value of Danny's investment in mutual funds and the bottom region in black represents the value of Danny's investment in a CD. The thickness of a region at a particular time tells you its value at that time.  Use the graph to answer the question.
-In which year was the total value of Danny's investments the greatest?
Definitions:
Board of Directors
A group of appointed or elected members who jointly oversee the activities of an organization or corporation.
Insider Trading
The trading of a company's stocks or other securities by individuals with access to non-public, material information about the company.
Shareholder
refers to an individual or entity that owns one or more shares of stock in a corporation, thereby holding a portion of ownership.
Corporation
A legal entity that is separate from its owners, with its own rights and liabilities, allowing it to own property, enter contracts, and be sued.
Q27: The table contains the weights (in
Q28: Construct an unbinned frequency table for
Q30: The fuel economy of a car is
Q34: 49, 34, and 48 students are selected
Q45: <img src="https://d2lvgg3v3hfg70.cloudfront.net/TB7023/.jpg" alt="
Q61: The cost of tuition at one
Q71: Among 50 of the 302 patients admitted
Q79: A clinic gives a drug to a
Q94: Suppose that your income is at the
Q112: Following the Republican National Convention, a poll