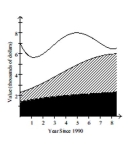
The stacked line chart shows the value of each of Danny's investments. The stacked line chart contains three regions. The uppermost unshaded region represents the value of Danny's investment in individual stocks. The center shaded region represents the value of Danny's investment in mutual funds and the bottom region in black represents the value of Danny's investment in a CD. The thickness of a region at a particular time tells you its value at that time.  Use the graph to answer the question.
-In which year was the total value of Danny's investments the least?
Definitions:
Allison TC10
A fully automatic transmission designed by Allison for tractor-trailers, combining the efficiency of manual transmissions with the convenience of automatics.
ECPC Valves
Electronic Control Pressure Compound valves, used in hydraulic systems for precise fluid control in various industrial applications.
PWM Controlled
Pertains to a system or device that is regulated using Pulse Width Modulation, a technique used to control power delivery efficiency and precision.
Q8: The cost of renting a car
Q10: The test scores of 15 students
Q26: The college daily reported: "450 students living
Q36: 234, 231, 206, 128, 234, 201, 268,
Q69: Lengths of human pregnancies<br>A)Symmetric<br>B)Right-skewed<br>C)Left-skewed
Q71: In the town of Oak Forest,
Q74: Weights of the first graders at a
Q102: A red ball is drawn from a
Q125: Waiting time at a bus stop (in
Q147: A reputable research group did a study