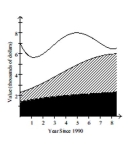
The stacked line chart shows the value of each of Danny's investments. The stacked line chart contains three regions. The uppermost unshaded region represents the value of Danny's investment in individual stocks. The center shaded region represents the value of Danny's investment in mutual funds and the bottom region in black represents the value of Danny's investment in a CD. The thickness of a region at a particular time tells you its value at that time.  Use the graph to answer the question.
-In which year was the value of Danny's investment in individual stocks the highest?
Definitions:
Q7: John decides to play the state lotto,
Q7: The table below shows the times
Q8: A student in a statistics class chooses
Q13: A marketing firm does a survey to
Q22: A computer is purchased for $4600. Its
Q26: Seven of 23 ticketed speeders were also
Q38: In tests of a computer component,
Q42: You drive along the highway at a
Q59: A nutritionist wants to conduct a study
Q100: A random sample of 30 households