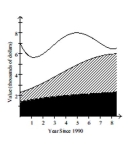
The stacked line chart shows the value of each of Danny's investments. The stacked line chart contains three regions. The uppermost unshaded region represents the value of Danny's investment in individual stocks. The center shaded region represents the value of Danny's investment in mutual funds and the bottom region in black represents the value of Danny's investment in a CD. The thickness of a region at a particular time tells you its value at that time.  Use the graph to answer the question.
-In which year was the value of Danny's investment in individual stocks the least?
Definitions:
Q3: Drawing a black six and then a
Q5: Bases have a pH Lower than 7.
Q8: a. The amount of income taxes paid
Q20: Sales of gloves in Boston over a
Q66: 1 - The average score for the
Q82: Number of days worked last year by
Q87: The highest temperatures ever recorded (in
Q125: Analysis of the raw data of a
Q126: A local TV station wanted to report
Q149: A concerned parent wants to determine the