Essay
Provide an appropriate response.
-The graph shows the increases in a certain expenditure over a four-year period. What is wrong with the graph? 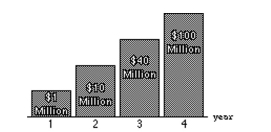
Definitions:
Related Questions
Q13: Suppose a radioactive substance has a
Q15: Dave is a college student contemplating a
Q49: A manufacturer makes ball bearings that are
Q51: A car insurance company conducted a
Q53: The following table gives the distribution
Q95: Based on a randomly selected group of
Q112: When tossing a fair coin, which
Q138: 1 - The tallest girl on
Q234: The permutation formula can be used
Q258: Suppose you are playing a game