The graph below shows the approximate annual percentage growth rate in world population for the years 1960 through
2010. Data is estimated by the UN Census Bureau. 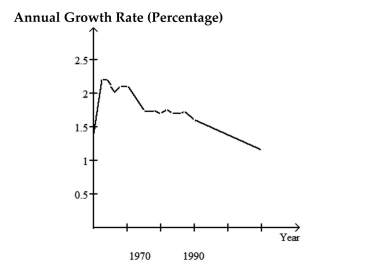 Use the graph to answer the question.
-Describe the trend in world population during the period 1990-2000
Definitions:
Pretax Income
The income a company generates before any taxes are deducted.
Q28: A company advertises an average of 42,000
Q35: The following table shows the number
Q38: <span class="ql-formula" data-value="\$ 200"><span class="katex"><span class="katex-mathml"><math xmlns="http://www.w3.org/1998/Math/MathML"><semantics><mrow><mi
Q74: Which of the statements below suggests
Q90: How many 3-digit numbers can be formed
Q124: The amount of Jen's monthly phone
Q153: In a study to determine the most
Q163: The bank that pays the highest annual
Q167: Weights of new-born babies<br>A)Left-skewed<br>B)Symmetric<br>C)Right-skewed
Q178: At one college, GPA's are normally distributed