The graph below shows the approximate annual percentage growth rate in world population for the years 1960 through
2010. Data is estimated by the UN Census Bureau. 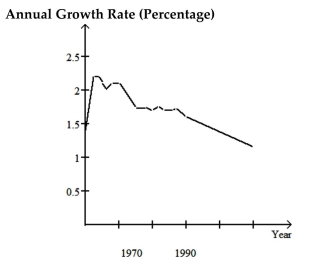 Use the graph to answer the question.
-In which year(s) , if any, during the period 1960-2010 is world population constant?
Definitions:
Poisson Distribution
A probability distribution that measures the probability of a given number of events happening in a fixed interval of time or space when these events occur with a known constant mean rate and independently of the time since the last event.
P-Value Approach
A method in statistical hypothesis testing that uses the calculated probability to determine the significance of the observed data.
Emergency Calls
Telephone calls made to emergency services in situations of acute need for assistance.
Chi-Square Distribution
A statistical distribution used for hypothesis testing of categorical variables.
Q1: Which of the following describes a study
Q9: The overall U.S. death rate for 60
Q33: <span class="ql-formula" data-value="8 n - 10 =
Q51: The bar graph below shows the relative
Q51: A company claims that it pays women
Q171: <span class="ql-formula" data-value="y / 16 + 8
Q191: During the questioning of 78 potential
Q209: You put $422 per month in an
Q216: Paul has about $1800 available for all
Q258: Suppose you are playing a game