The stack plot below shows the value of each of Danny's investments. The stack plot contains three regions. Theuppermost unshaded region represents the value of Danny's investment in individual stocks. The center shaded regionrepresents the value of Danny's investment in mutual funds and the bottom region in black represents the value ofDanny's investment in a CD. The thickness of a region at a particular time tells you its value at that time. 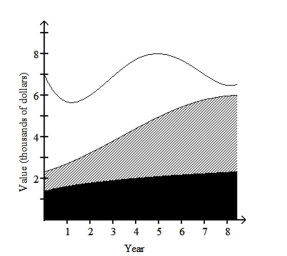 Use the graph to answer the question.
-In which year was the total value of Danny's investments the greatest?
Definitions:
Promotional Style
The distinct approach or method a brand uses to market and communicate its products, services, or messages to its target audience.
Snarky Style
A communication style characterized by sarcasm, mocking humor, or contempt, often used in social media discourse.
Content Creation
The process of producing material such as text, images, and videos to engage audiences on various media platforms.
Content Curation
Identifying and sharing the best and most relevant content on a specific topic with your audience.
Q1: An environmental group is investigating global warming
Q14: Number of siblings of adults in the
Q73: Find the mean for the given
Q83: Calculate the annual interest for a $1000
Q127: "38% of adults in the United States
Q145: If two fair dice are rolled,
Q157: A tourist in France wants to
Q170: In 50 rolls of a die, you
Q179: In a certain lottery, 6 different numbers
Q255: <span class="ql-formula" data-value="\$ 12,000"><span class="katex"><span class="katex-mathml"><math xmlns="http://www.w3.org/1998/Math/MathML"><semantics><mrow><mi