The stack plot below shows the value of each of Danny's investments. The stack plot contains three regions. Theuppermost unshaded region represents the value of Danny's investment in individual stocks. The center shaded regionrepresents the value of Danny's investment in mutual funds and the bottom region in black represents the value ofDanny's investment in a CD. The thickness of a region at a particular time tells you its value at that time. 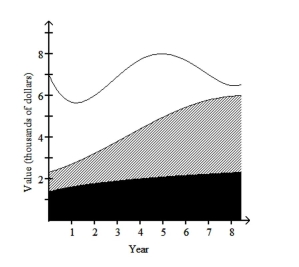 Use the graph to answer the question.
-In year 8, what was the approximate value of Danny's investment in mutual funds?
Definitions:
Downward-Sloping
Refers to a line or curve on a graph that moves from the upper left to the lower right, indicating a negative relationship between two variables.
Demand Curve
A chart that displays the connection between a product's price and the amount consumers are willing to purchase.
Marginal Revenue
The additional income gained from selling one more unit of a product or service.
Marginal Costs
The increase in total production cost that comes from making or producing one additional unit.
Q5: Explain in your own words the difference
Q21: Calculate the monthly payment for a student
Q43: In a recent year, the total receipts
Q89: Of the mean, median, and mode, which
Q93: You could take a 15-week, three-credit college
Q100: Calculate the monthly payment for a home
Q134: Describe the trend in world population during
Q155: Main form of exercise for employees
Q158: A TV show announced that their survey
Q181: <img src="https://d2lvgg3v3hfg70.cloudfront.net/TB3069/.jpg" alt=" A)Weak positive correlation