Answer the question.
-A television manufacturer sold three times as many televisions in 1995 as it did in 1985. To
illustrate this fact, the manufacturer draws a pictogram as shown below. The television on
the right is three times as tall and three times as wide as the television on the left. 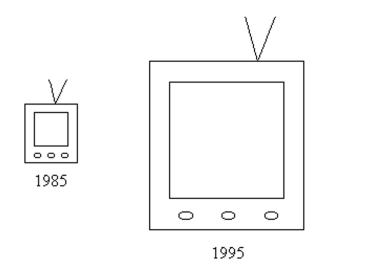 Why is this pictogram misleading? What visual impression is portrayed by the pictogram?
Definitions:
Significance Level
The threshold at which the results of statistical analysis are considered significant, typically set before the data is collected.
Repair Costs
Expenses associated with fixing or restoring damaged items or systems to their functional state.
T-test
A statistical test used to compare the means of two groups to determine if they are significantly different from each other.
Population Variances
The squared difference between each data point in the entire population and the mean of the population, indicating overall data spread.
Q3: Which of the statements below suggests an
Q18: The following table show the results
Q36: Suppose that a test for a disease
Q50: The ages of 25 patients who
Q68: A = 64.9 is the average number
Q88: I was offered a 30-year mortgage at
Q134: Lengths of human pregnancies<br>A)Right-skewed<br>B)Left-skewed<br>C)Symmetric
Q144: The mayor of a city claims
Q202: In a clinical study of an
Q242: Your true weight is <span