Multiple Choice
Solve the problem. Refer to the table if necessary. 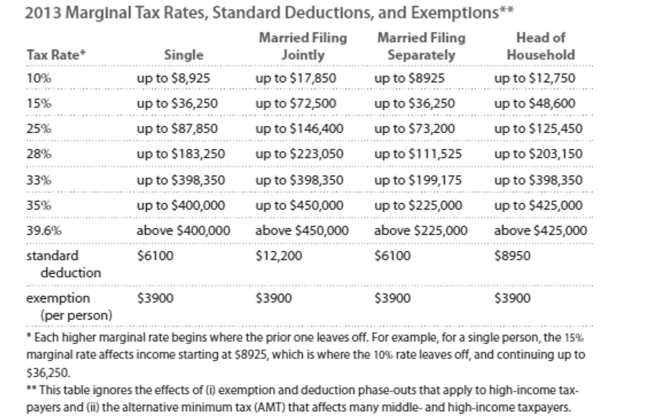
-Carl is single and has a taxable income of $43,367. Calculate the amount of tax owed.
Definitions:
Related Questions
Q8: The national debt of a small country
Q43: Can acupuncture relieve anxiety? [The level of
Q75: The total number of breaths taken in
Q93: Convert a weight of 16 pounds into
Q123: People who take more vacations score higher
Q125: Assume that you breathe once every 10
Q213: A full-service broker offers advice based on
Q220: <img src="https://d2lvgg3v3hfg70.cloudfront.net/TB3069/.jpg" alt=" Identify the utility
Q221: Any test for a disease has a
Q224: Jim is in the 15% tax bracket