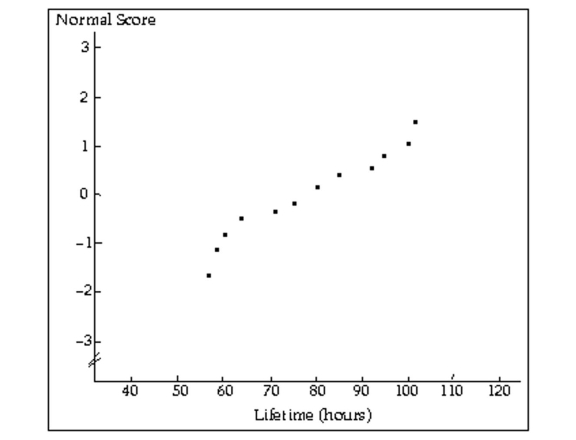
Two graphical displays are given for a set of data. A hypothesis test is to be performed for the mean of the populationfrom which the data were obtained. Would it be reasonable to use a one-mean z-test? Explain your reasoning. Assumethat the population standard deviation is known.
-A normal probability plot and a stem-and-leaf diagram of the data are given below. 
Definitions:
Management Incentive Fee
A fee paid to fund managers for achieving performance targets, often a percentage of the investment gains.
Standard Deviation
A measure of the dispersion or variation in a set of data points, often used in finance to quantify the risk of an investment.
Positive Alpha
A metric indicating that an investment has performed better than its benchmark index, suggesting superior management or strategy.
Long Equity
An investment strategy where investors purchase stocks or equity securities with the expectation that their value will increase over time.
Q6: The mean height for a population is
Q6: A hypothesis test for a population
Q16: Find the straight-line distance between the grocery
Q30: Let <span class="ql-formula" data-value="x"><span class="katex"><span
Q36: salty things, sweet things, tangy things
Q69: A confidence interval for a population
Q70: On the same axes sketch normal
Q74: A company manufactures calculators in batches of
Q138: In one county, the conviction rate for
Q162: Suppose a coin is tossed four