Two graphical displays are given for a set of data. A hypothesis test is to be performed for the mean of the populationfrom which the data were obtained. Would it be reasonable to use a one-mean z-test? Explain your reasoning. Assumethat the population standard deviation is known.
-A normal probability plot and a histogram plot of the data are given below. 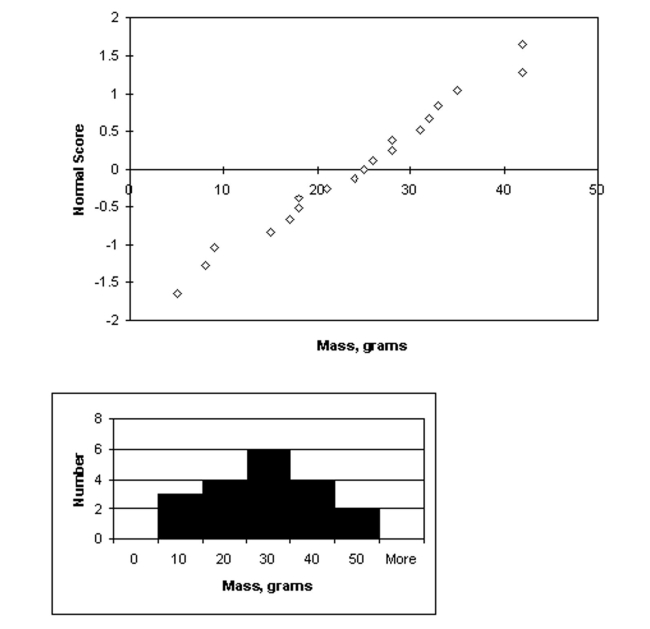
Definitions:
Earnings Per Share
A company's profit divided by the number of outstanding shares of its common stock, serving as an indicator of the company's profitability.
Book Value
Book value is the net value of a company's assets minus its liabilities, often used to assess if a stock is under or overvalued.
Market-to-Book Ratio
A financial valuation metric comparing a company's current market price to its book value.
Common-Size Statement
A financial statement that presents all line items as a percentage of a common base figure, facilitating comparison across different periods or companies.
Q7: What generally happens to the sampling error
Q13: Give an expression for the confidence
Q24: <img src="https://d2lvgg3v3hfg70.cloudfront.net/TB3069/.jpg" alt=" A)
Q28: An acre is equal to 43,560 square
Q40: 0.0002 <br>A) <span class="ql-formula" data-value="\frac
Q40: Given 2.2 inches is one side
Q43: Describe parametric and nonparametric tests. Explain why
Q45: The vanishing point of a picture with
Q52: Jenny is conducting a hypothesis test
Q116: Suppose you build an architectural model of