Two graphical displays are given for a set of data. A hypothesis test is to be performed for the mean of the populationfrom which the data were obtained. Would it be reasonable to use a one-mean z-test? Explain your reasoning. Assumethat the population standard deviation is known.
-A normal probability plot and a stem-and-leaf diagram of the data are given below. 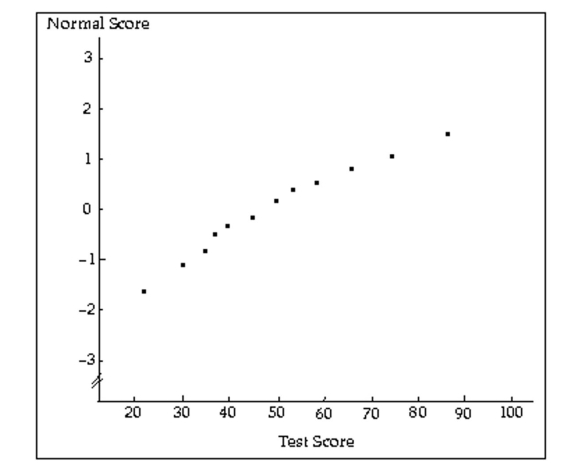
Definitions:
Contemporary Capitalism
Refers to the current phase of capitalism characterized by global trade, advanced information technology, and a dominant service sector.
Affect Theory
A theoretical approach that focuses on bodily responses and emotional experiences as central to understanding human behavior and social dynamics.
Poststructural
A theoretical perspective that critiques and seeks to move beyond the structures established by traditional structuralism, emphasizing the instability of meaning and the role of power in the construction of knowledge.
Patricia Clough
An academic known for her work in feminist theory, affect theory, and the analysis of technological and media influences on culture.
Q23: <span class="ql-formula" data-value="290.49 ^ { \circ }"><span
Q24: The test scores of 5 students are
Q24: In 1995, the mean math SAT
Q39: Determine the two z-scores that divide the
Q45: A normal probability plot and a histogram
Q45: (False Cause)Since I brought my umbrella, it
Q56: Go fly a kite.<br>A)Not a proposition<br>B)Proposition
Q59: The stream frontage is174 feet in length
Q101: Estimate the probability of getting exactly 43
Q158: When a coin is tossed four