A hypothesis testing situation is given. The population standard deviation, sample size, and significance level are given.Complete the table to give the probability of a Type II error and the power for each of the given values of µ. Use the table to draw the power curve.
-In 1990, the average math SAT score for students at one school was 472. Five years later, a teacher wants to perform a hypothesis test to determine whether the average SAT score of students at the school has changed from the 1990 mean of 472. Preliminary data analyses indicate that it is reasonable to apply a z-test. The hypotheses are Assume that , and the significance level is . Find the probability of a Type II error and the power for . 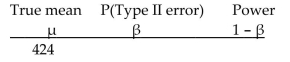 430 440 450 460 470 474 484 494 504 514 520
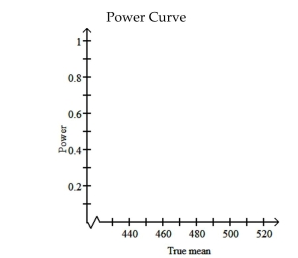
Definitions:
Retailers
Businesses that sell goods or merchandise directly to consumers through various channels, such as brick-and-mortar stores, online platforms, or through catalog sales.
B2C Marketing
Business-to-consumer marketing, which involves the sale of products or services from businesses directly to individual consumers.
Consumers
Individuals or groups who purchase goods and services for personal use and not for manufacture or resale.
Supply Chain Marketing
A holistic approach to marketing that integrates the entire supply chain, from product development to the delivery to the end consumer, to enhance customer value and efficiency.
Q5: For a certain type of fabric, the
Q17: The data below consists of the
Q32: Find the z-score for which the area
Q49: If the sample size is small (less
Q75: A square with sides of length
Q88: Premise: If you break curfew, then you
Q100: City A is at about latitude 51°N
Q106: A multiple choice test consists of 60
Q148: If you received a refund of over
Q186: A television commercial shows two people who