Solve the problem.
-Here are boxplots of the points scored during the first 10 games of the basketball season for both Caroline and Alexandra. Summarize the similarities and differences in their performance so far. 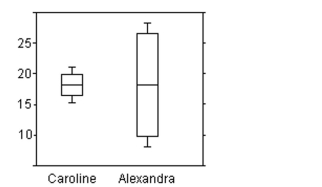
Definitions:
Income
The amount of money or earnings received by a person, family, or organization, usually measured on a monthly or yearly basis.
Indicator Variable
A variable that takes the value 1 to indicate the presence of a condition or characteristic and 0 to indicate its absence.
Color
The characteristic of visual perception described through categories such as hue, saturation, and brightness.
Logistic Regression
A statistical method used to analyze a dataset in which there are one or more independent variables that determine an outcome. The outcome is measured with a dichotomous variable (where there are only two possible outcomes).
Q2: A new business had the following
Q12: The age distribution of students at
Q35: The heights of people in a certain
Q41: A random sample of federal income
Q44: The average speed of cars passing a
Q53: Obtain the five-number summary for the given
Q62: For the year 2006 , a
Q71: A researcher wishes to test whether
Q109: The frequency chart shows the distribution
Q110: When investigating times required for drive-through