A graphical display of a data set is given. Identify the overall shape of the distribution as (roughly) bell-shaped,triangular, uniform, reverse J-shaped, J-shaped, right skewed, left skewed, bimodal, or multimodal.
-The ages of a group of patients being treated at one hospital for osteoporosis are summarized in the frequency histogram below. 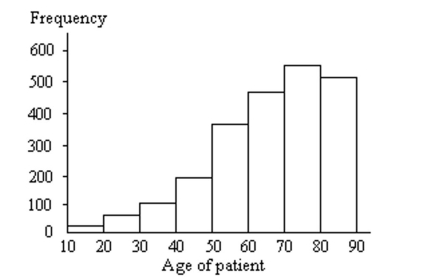
Definitions:
Emotional Numbness
A state in which an individual feels detached from their emotions or feelings, often as a response to trauma or extreme stress.
Regret
Involves feeling sorry for one’s misfortunes, limitations, losses, transgressions, shortcomings, or mistakes.
Anger
An emotional response to a real or imagined threat or provocation
Suicide Note
A suicide note is a message left by an individual who intends to take their own life, often explaining the reasons behind the decision or expressing last thoughts to loved ones.
Q12: An <span class="ql-formula" data-value="\mathrm {
Q16: Of the 94 people who answered "yes"
Q31: 496, 598, 503, 528, 565, 601, 576,
Q35: Listed below are grade averages for randomly
Q39: The ages of a group of patients
Q40: A social scientist is interested in
Q65: The table below shows the weights
Q99: Given that 900 people were aged between
Q101: Construct a Venn diagram representing the
Q160: The number of vehicles passing through