The bar graph below shows the average cost of renting a studio in one city in each of the years 2002 through 2006. 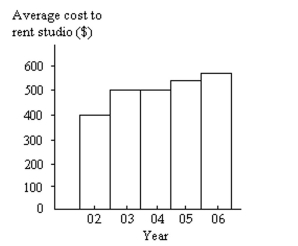 By what percentage does the average price increase from 2002 to 2003? Obtain a truncated version of the graph by sliding a piece of paper over the bottom of the graph so that the bars start at 300. In the truncated graph, by what percentage does the price appear to increase from 2002 to 2003? Why is the truncated graph misleading?
Definitions:
Crystallin Protein
Specialized proteins found in the eye lens, responsible for maintaining its transparency and focusing ability.
Cornea
Clear, protective covering at the front of a vertebrate eye; helps focus light on the retina.
Lens
A transparent structure in the eye that focuses light rays onto the retina, allowing for clear vision.
Q8: In the context of a two-proportions
Q24: Suppose that you wish to estimate
Q25: Do you think that the Kruskal-Wallis test
Q33: The table below shows the age
Q53: A <span class="ql-formula" data-value="\chi ^
Q54: For a certain linear equation, as x
Q57: Suppose that you wish to construct
Q60: Three board members for a nonprofit
Q67: Arranging the age of students in a
Q70: The weekly salaries (in dollars)of sixteen