The bar graph below shows the number of car accidents occurring in one city in each of the years 2001 through 2006. The number of accidents dropped in 2003 after a new speed limit was imposed. Why is the graph misleading? How would you redesign the graph to be less misleading? 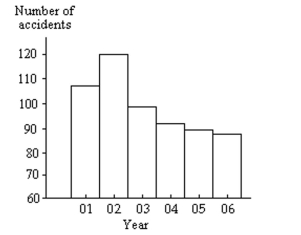
Definitions:
Exam Papers
Documents containing questions or problems used to test a student's knowledge on a particular subject.
Sampling Distribution
The probability distribution of a given statistic based on a random sample, often used to estimate population parameters.
Birth Weight
The weight of a baby at the time of its birth, an important indicator of newborn health and future development.
Population Variance
A measure that quantifies the degree to which values in an entire population vary from the population mean.
Q5: y = 1 <br>A)y-intercept = -1, slope
Q27: Give an example of a situation in
Q32: An auto insurance company was interested
Q43: Suppose that two balanced dice are
Q45: The partially filled contingency table gives
Q65: The following table gives the top
Q75: An airline's public relations department says that
Q80: A researcher wishes to estimate the proportion
Q95: The weights (in ounces)of 14 different
Q145: Following is the number of reported