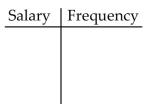
Use cutpoint grouping to organize these data into a frequency distribution.
-A government researcher was interested in the starting salaries of humanities graduates. A random sample of 30 humanities graduates yielded the following annual salaries. Data are in thousands of dollars, rounded to the nearest hundred dollars. Construct a frequency distribution for these annual starting salaries. Use 20 as the first cutpoint and classes of equal width 4 . 
Definitions:
Post-Secondary Institution
Educational establishments that provide learning and training opportunities beyond secondary education, such as colleges and universities.
Diversity
The practice or quality of including or involving people from a range of different social and ethnic backgrounds and of different genders, sexual orientations, etc.
Organizational Performance
The ability of an organization to achieve its goals and objectives, often measured by financial results, efficiency, and market share.
Competitive Advantage
The attribute or set of attributes that allows an organization to surpass its competitors through superior performance or value delivery.
Q7: A teacher records the test scores for
Q12: In a random sample of 360 women,
Q37: A medical school claims that more than
Q48: <span class="ql-formula" data-value="\mathrm { x } _
Q50: An article in a journal reports that
Q61: <img src="https://d2lvgg3v3hfg70.cloudfront.net/TB2839/.jpg" alt="
Q102: Construct a stem-and-leaf diagram for the
Q103: Give an example of a data set
Q135: A variable x has the possible
Q136: The students in Hugh Logan's math