A graphical display of a data set is given. Identify the overall shape of the distribution as (roughly) bell-shaped,triangular, uniform, reverse J-shaped, J-shaped, right skewed, left skewed, bimodal, or multimodal.
-A relative frequency histogram for the sale prices of homes sold in one city during 2006 is shown below. 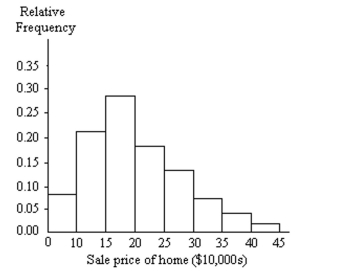
Definitions:
Correlational Research
A type of non-experimental research method used to determine, describe, and predict how variables are naturally related in the real world without any experimental manipulation by the researcher.
Two-Tailed
Pertaining to tests of statistical significance that consider both directions of effects, allowing for the assessment of the possibility of both positive and negative differences.
Sample Size
The number of observations or data points collected in a study.
Statistical Procedure
A statistical procedure involves methods and operations applied on data to analyze, interpret, or draw conclusions from it.
Q8: What is the relationship between the linear
Q10: <span class="ql-formula" data-value="\begin{array} { r | r
Q19: When performing a one-way ANOVA, two of
Q26: Ten students in a graduate program
Q49: The equation of the line is
Q55: The following table shows the heights
Q55: A survey of 300 union members in
Q59: The table contains data from a
Q77: <span class="ql-formula" data-value="\mathrm { s } _
Q136: The students in Hugh Logan's math