A one-way ANOVA is to be performed. Independent random samples are taken from two populations. The sample data are depicted in the dotplot below. Is it reasonable to conclude that the difference between the sample means is due to a difference between the population means and not to variation within the populations? Do you think the null hypothesis would be rejected? Explain your thinking. 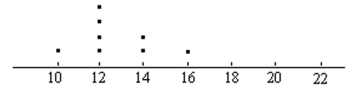 Sample from population 1 (mean = 12.75)
 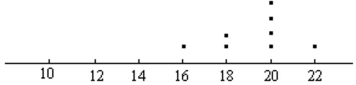 Sample from population 2
Definitions:
Ontario Ministry
A branch of the government in the province of Ontario, Canada, responsible for a specific department or area of public policy.
Teaching Experience
The duration and quality of time that an individual has spent in the educational field as a teacher.
Stem-And-Leaf Display
A method of displaying quantative data to show its distribution, where each data point is split into a "stem" (the initial digit or digits) and a "leaf" (the last digit).
Timeplot
A graphical representation of how a variable changes over time, displaying data points connected by lines to show trends or patterns.
Q6: <span class="ql-formula" data-value="\text { Explain what each
Q9: When you invest your money in a
Q11: In a study of the relationship between
Q22: Is it possible for a sample linear
Q39: With individual lines at the checkouts, a
Q54: Here are the average mathematics achievement
Q64: A supplier of 3.5" disks claims that
Q65: The following table gives the top
Q70: A researcher wishes to determine whether
Q125: A relative frequency distribution is given