SCENARIO 2-16
The figure below is the percentage polygon for the amount of calories for a sample of 36 pizzas
products where the upper limits of the intervals are: 310, 340, 370, 400 and 430.
Percentage Polygon for Calories 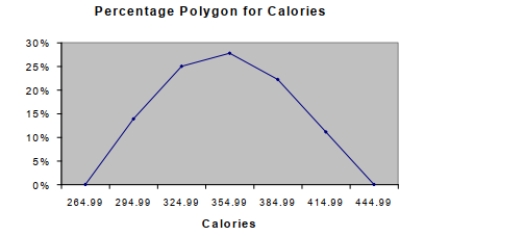
-Referring to Scenario 2-16, roughly what percentage of pizza products contains between 340
And 400 calories?
Definitions:
Relationships
The ways in which two or more concepts, objects, or people are connected, or the state of being connected.
Qualitative Method
Research methods that collect non-numerical data used to understand concepts, thoughts, or experiences.
Interview
The process of asking questions of a respondent, usually face to face or by phone or video, to elicit information the researcher is interested in. See also fully structured interviews, semistructured interviews, and unstructured interviews.
Speech Community
A group of people who share a set of linguistic norms and patterns, facilitating communication within the group.
Q25: <span class="ql-formula" data-value="x=2 t-1, y=t^{2}+5 ;-4 \leq
Q33: The value of the cumulative standardized normal
Q48: Referring to Scenario 2-12, _ percent of
Q62: An experimental model for a suspension bridge
Q62: True or False: Given below is the
Q106: <span class="ql-formula" data-value="11 x ^ { 2
Q109: Focus at <span class="ql-formula" data-value="(
Q126: True or False: The relative frequency is
Q155: True or False: When dealing with human
Q190: A reflecting telescope has a mirror