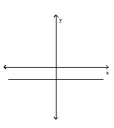
Use the horizontal line test to determine whether the function is one-to-one.
-
Definitions:
Null Hypothesis
A hypothesis in statistical analysis that assumes no significant effect or difference exists between specified populations or parameters.
Two-Way Table
A tabular method to display the frequencies of occurrences of variables that are classified according to two categorical dimensions.
Association
The relationship or correlation between two or more variables or factors in a study.
Chi-Square Test
A statistical method used to assess the differences between categorical variables in a contingency table.
Q59: Find a so that the graph
Q143: <span class="ql-formula" data-value="\ln \left( 1.65 \cdot e
Q189: <span class="ql-formula" data-value="f(x)=-5 x^{5}"><span class="katex"><span class="katex-mathml"><math xmlns="http://www.w3.org/1998/Math/MathML"><semantics><mrow><mi>f</mi><mo
Q224: For what numbers <span class="ql-formula"
Q227: The accompanying tables represent a function
Q302: <span class="ql-formula" data-value="\mathrm { f } (
Q312: <span class="ql-formula" data-value="\log _ { 3 }
Q393: <span class="ql-formula" data-value="\log _ { 4 }
Q433: {(12, -18), (-12, -18), (20, -8)}<br>A) Yes<br>B)
Q469: Between 8:30 a.m. and 9:30 a.m.,