Solve the problem.
-The graph shows an idealized linear relationship for the average monthly payment to retirees from 1995 to 1999. Use the midpoint formula to estimate the average payment in 1997. Average Monthly Payment to Retirees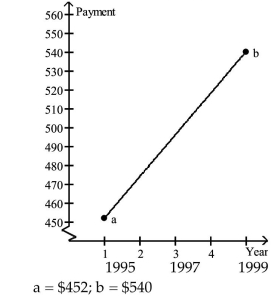
Definitions:
Q19: For what value of <span
Q189: <span class="ql-formula" data-value="f ( x ) =
Q206: <span class="ql-formula" data-value="y=(x+3)^{3}"><span class="katex"><span class="katex-mathml"><math xmlns="http://www.w3.org/1998/Math/MathML"><semantics><mrow><mi>y</mi><mo>=</mo><mo stretchy="false">(</mo><mi>x</mi><mo>+</mo><mn>3</mn><msup><mo
Q379: <span class="ql-formula" data-value="\left( x ^ { 2
Q404: <span class="ql-formula" data-value="y = 5 x ^
Q424: For what values of a does
Q487: The graph shows an idealized linear
Q492: <span class="ql-formula" data-value="f ( x ) =
Q494: <span class="ql-formula" data-value="f ( x ) =
Q502: center <span class="ql-formula" data-value="( -