The box plot shown below was constructed for the amount of soda that was poured by a filling machine into 12-ounce soda cans at a local soda bottling company. 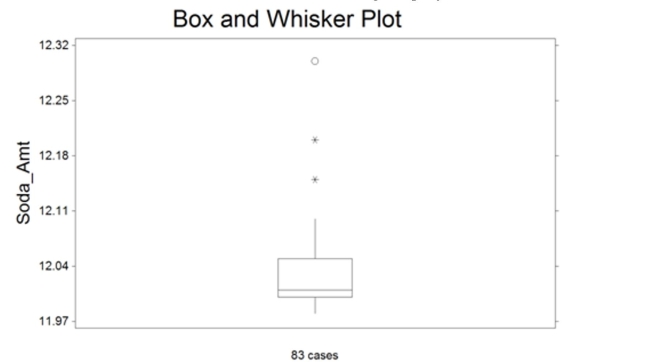 We see that one soda can received 12.30 ounces of soda on the plot above. Based on the box plot
Presented, how would you classify this observation?
Definitions:
Directionality Problem
An issue that arises when it is unclear whether one variable causes changes in another or vice versa, complicating the interpretation of study results.
Random Sampling
Random sampling is a technique used in research to select a sample group from a larger population using random methods, ensuring that every individual has an equal chance of being chosen.
Causality
The relationship between cause and effect, where one event (the cause) initiates the occurrence of another event (the effect).
Case Study
A case study is an in-depth analysis of an individual, group, or event, extensively researched over a period with the aim of uncovering unique patterns or insights.
Q9: The slices of a pie chart must
Q11: If every sample point in event
Q15: Online classes are becoming more and more
Q44: It is safe to conduct t-tests on
Q65: What are rank statistics (or rank tests)?
Q78: Four brands of baseball bats were
Q83: In a study to determine the least
Q180: There are 10 movies that Greg would
Q219: Unions and intersections cannot be defined
Q252: A fast-food restaurant chain with 700