The figure shows the graphs of the cost and revenue functions for a company that manufactures and sells binoculars. Use
the information in the figure to answer the question. 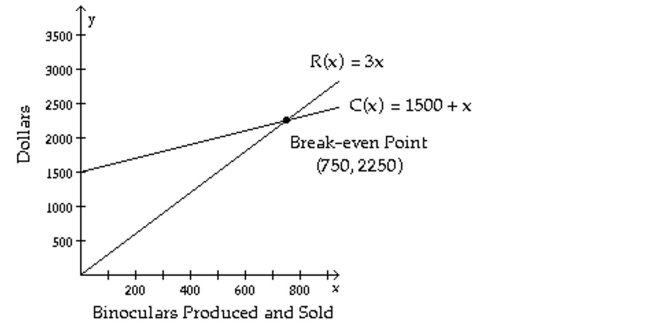
-How many binoculars must be produced and sold for the company to break even?
Definitions:
Operating
Refers to the functioning or management of operations within a business or computer environment.
Financial Reports
Financial reports are formal records of the financial activities and position of a business, person, or other entity.
Public Accountants
Professionals who provide accounting services to the general public, including auditing, tax preparation, and consulting services.
Q3: <span class="ql-formula" data-value="\left\{ \begin{array} { l }
Q19: <span class="ql-formula" data-value="- 6 x ^ {
Q95: Find <span class="ql-formula" data-value="h (
Q118: <span class="ql-formula" data-value="\left\{ \begin{aligned}y & = 2
Q128: Find <span class="ql-formula" data-value="f (
Q138: <span class="ql-formula" data-value="\begin{array} { l } (
Q145: <span class="ql-formula" data-value="- \frac { 7 y
Q183: <span class="ql-formula" data-value="16 x - x ^
Q227: During a walk-a-thon, Rosilyn walked 18
Q260: <span class="ql-formula" data-value="\left( 4.7 \times 10 ^