The figure shows the graphs of the cost and revenue functions for a company that manufactures and sells binoculars. Use
the information in the figure to answer the question. 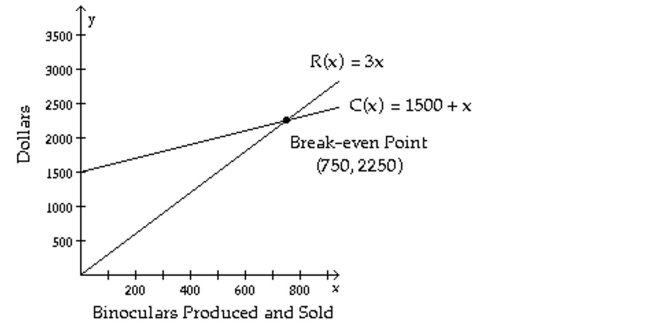
-At the break-even point both cost and revenue are what?
Definitions:
Q1: The sum of two numbers is 14,
Q24: <span class="ql-formula" data-value="7 \cdot 3 ^ {
Q56: <span class="ql-formula" data-value="\begin{array} { l } C
Q78: <span class="ql-formula" data-value="( 5,0 )"><span class="katex"><span class="katex-mathml"><math
Q94: <span class="ql-formula" data-value="\frac { 6 \times 10
Q132: <span class="ql-formula" data-value="x ^ { 2 }
Q153: <span class="ql-formula" data-value="7 ^ { - 1
Q263: <span class="ql-formula" data-value="\begin{array} { l } 3
Q297: <span class="ql-formula" data-value="\left( - 4 z ^
Q300: <span class="ql-formula" data-value="\left( x ^ { 2