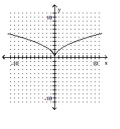
Determine whether the graph of the function is the graph of a one-to-one function.
-
Definitions:
Constant Unit Cost
The situation where the cost to produce each additional unit of output remains unchanged.
Inverse Demand Curve
A graphical representation showing the relationship between the price of a good and the quantity demanded, plotted with price on the y-axis and quantity on the x-axis, inversely.
Cartel
An agreement among competing firms to control prices, production, and distribution of goods, often to restrict competition and maximize profits.
Price Elasticity
A metric that quantifies the sensitivity of the quantity of a product demanded to fluctuations in its price, depicted as a percentage alteration.
Q40: The process of writing a quadratic equation
Q67: <span class="ql-formula" data-value="( 5 x - 2
Q90: <span class="ql-formula" data-value="h ( x ) =
Q101: <span class="ql-formula" data-value="S _ { 5 }"><span
Q121: <span class="ql-formula" data-value="\log _ { 3 }
Q201: <span class="ql-formula" data-value="2 x ^ { 2
Q209: <span class="ql-formula" data-value="- 3 \geq \frac {
Q228: <span class="ql-formula" data-value="25 x ^ { 2
Q297: <span class="ql-formula" data-value="\log _ { 2 }
Q305: Terms with the same variables raised to