The figure represents the average credit card debt for selected households in Silerville. 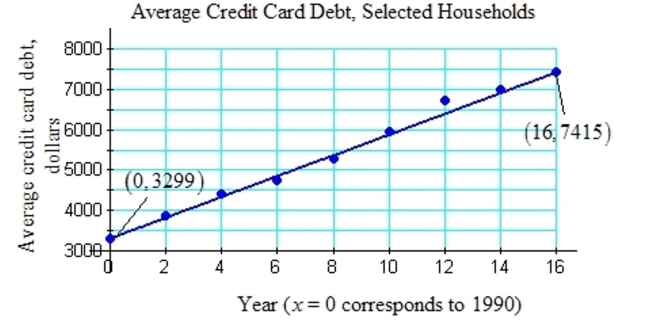 Let y represent the credit card debt in dollars. Let x represent the year, where x = 0 corresponds to the year 1990, x = 4 represents 1994, and so on.
a. Use the ordered pairs given in the graph, (0, 3299) and (16, 7415) to find a linear equation to estimate the average credit card debt versus the year. Round the slope to the nearest tenth.
b. Use the model from (a) to estimate the average debt in 2003. Round to the nearest dollar.
c. Interpret the slope of the model in the context of this problem.
Definitions:
Leakage
The escape of resources from one part of an economy to another, often referring to money that is not retained within a local system.
Control Group
In experimental research, the group that does not receive the experimental treatment, serving as a baseline to compare the effects of the treatment.
False Positives
An error in which a test incorrectly indicates the presence of a condition that is not actually there.
Type II Error
A statistical error that occurs when one fails to reject a false null hypothesis, also known as a false negative.
Q2: An educational researcher is analyzing the
Q10: Joan has just moved into a
Q30: Indicate all the sets to which
Q43: Mauricio Cruz, a wine merchant for
Q44: Find the sum of the first 20
Q69: Indicate all the sets to which
Q76: A sociologist expects the life expectancy
Q97: Factor out the indicated quantity.
Q113: A postal worker can sort a day's
Q173: Factor out the GCF. <span