Multiple Choice
The following time-series plot presents the population growth (in percent) of a suburb of Atlanta, Georgia for each of the years 1990 through 2009. Estimate the amount by which the rate of growth changed from 1993 to 1995 .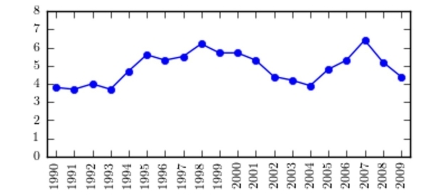
Definitions:
Related Questions
Q13: A histogram is a graph that represents
Q16: What is the critical value for a
Q20: Which of the following is not an
Q21: Classifying the fruit in a basket as
Q22: Find the mode for the following data?
Q24: Congress is required to insure that the
Q59: A _ is a characteristic or attribute
Q62: Inferential statistics is based on probability.
Q95: Given that the mean of a set
Q117: According to popular belief, 80% of adults