Multiple Choice
Find the indicated z score. The graph depicts the standard normal distribution with mean 0 and standard deviation 1.
-Shaded area is 0.8599. 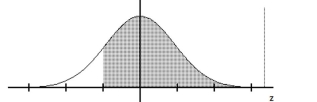
Definitions:
Related Questions
Q11: The systolic blood pressure (in mmHg)
Q20: The participants in a television quiz show
Q28: 100 employees of a company are asked
Q56: In a certain college, 33% of the
Q67: A math teacher gives two different tests
Q69: Interpret the symbol <span class="ql-formula"
Q71: Use the given sample data to
Q102: A machine has 12 identical components which
Q125: A cereal company claims that the
Q129: In a certain class of students, there