Multiple Choice
Find the indicated z score. The graph depicts the standard normal distribution with mean 0 and standard deviation 1.
-Shaded area is 0.0694. 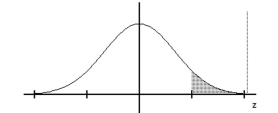
Definitions:
Related Questions
Q1: Describe an event whose probability of occurring
Q10: Suppose a mathematician computed the expected value
Q33: Suppose a student is taking a 5-response
Q39: According to a college survey, 22% of
Q66: In a game of roulette, Jorge places
Q104: <span class="ql-formula" data-value="\begin{array} { l l }
Q125: <span class="ql-formula" data-value="\begin{array} { l l }
Q156: In a certain population, 11% of people
Q193: Which of the following is true about
Q227: The mean is <span class="ql-formula"