Construct a modified boxplot for the data. Identify any outliers.
-The weights (in ounces) of 27 tomatoes are listed below.
A) Outliers: 1.7 oz, 4.2 oz
B) No outliers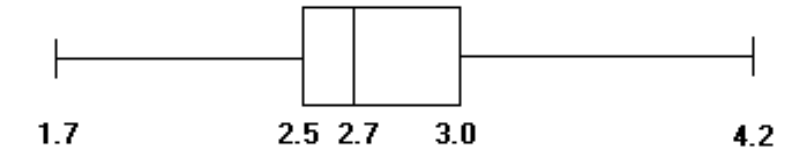
C) Outlier: 4.2 oz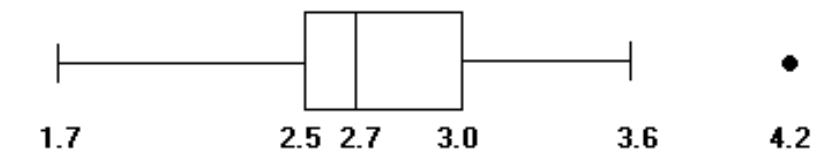
D) Outliers: 1.7 oz, 3.6 oz, 4.2 oz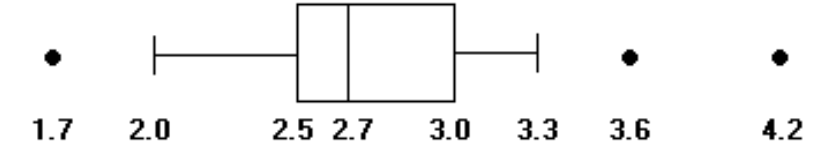
Definitions:
Depreciable Cost
The cost of a tangible asset minus its estimated salvage value, over which depreciation is calculated.
Depreciation Expense
An accounting method allocating the cost of a tangible asset over its useful life, reflecting its consumption, wear and tear, or obsolescence.
Expected Useful Life
The estimated length of time a fixed asset will be used in normal operations.
Placed in Service
Refers to the point in time when an asset begins to be used by a business for its intended purpose, marking the start of depreciation.
Q2: Random samples of four different models
Q5: Nationalities of survey respondents.<br>A) Nominal<br>B) Ratio<br>C) Ordinal<br>D)
Q11: <span class="ql-formula" data-value="\begin{array}{r|rrrrr}\mathrm{x} & 1 & 3
Q24: The normal monthly precipitation (in inches)
Q30: Define continuous and discrete data and give
Q30: Consider the frequency distribution below, which
Q55: Suppose you are playing a game of
Q61: In a certain town, 40% of
Q109: A history teacher assigns letter grades on
Q161: The manager of a bank recorded