Here are data about the average January low temperature in cities in the United States, and factors that might allow us to
predict temperature. The data, available for 55 cities, include: 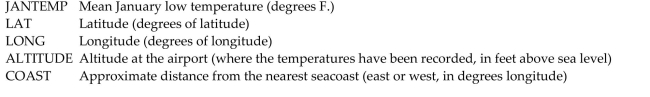 We will attempt to make a regression model to help account for mean January temperature and to understand the effects of
the various predictors.
At each step of the analysis you may assume that things learned earlier in the process are known.
Units Note: The "degrees" of temperature, given here on the Fahrenheit scale, have only coincidental language relationship to
the "degrees" of longitude and latitude. The geographic "degrees" are based on modeling the Earth as a sphere and dividing it
up into 360 degrees for a full circle. Thus 180 degrees of longitude is halfway around the world from Greenwich, England
(0°) and Latitude increases from 0 degrees at the Equator to 90 degrees of (North) latitude at the North Pole. 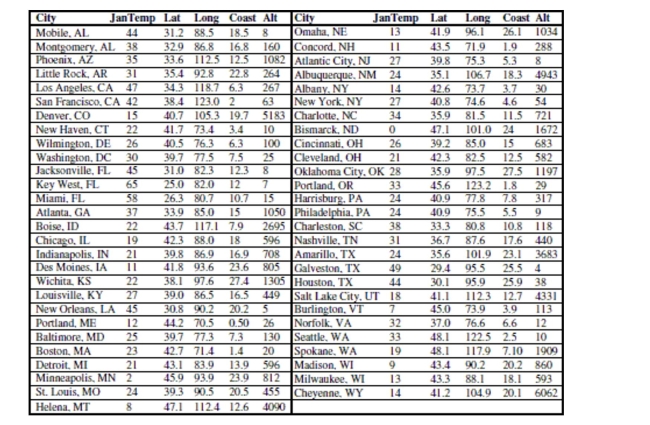
-Here is a partial regression plot for the coefficient of Long in the regression with a least
squares regression line added to the display: 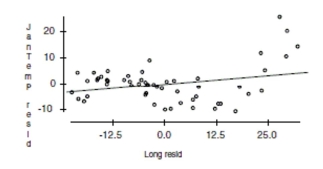
What is the slope of the line on this display? Does the display suggest that this slope
adequately summarizes the effect of longitude in the regression? Why/Why not?
Definitions:
Donald Boudreaux
An American economist known for his work in free market economics and public choice theory, and for being a prolific writer on these subjects.
Private Property
Assets or possessions owned by individuals or corporations and protected by law from unauthorized use or trespass by others.
Alternative Uses
The different purposes or applications a resource can be used for, highlighting economic choices and trade-offs.
Capital Goods
Long-lasting goods acquired and used by businesses to produce goods and services and contribute to their productive capacity.
Q1: What are the chances that if the
Q11: Homelessness is a problem in many
Q27: The height of 2-year-old maple tree is
Q34: Public opinion A member of the
Q35: Wildlife scientists studying a certain species of
Q60: Find and interpret a 95% confidence interval
Q69: Salaries of college professors.<br>A) Nominal<br>B) Ordinal<br>C) Interval<br>D)
Q77: According to the American Pet Products Manufacturers
Q99: Insulators Ceramics engineers are testing a new
Q131: In one town, the number of pounds