Of the 23 first year male students at State U. admitted from Jim Thorpe High School, 8 were offered baseball scholarships and 7 were offered football scholarships. The University admissions committee looked at the students' composite ACT scores (shown in table), wondering if the University was lowering their standards for athletes. Assuming that this group of students is representative of all admitted students, what do you think?
Boxplots: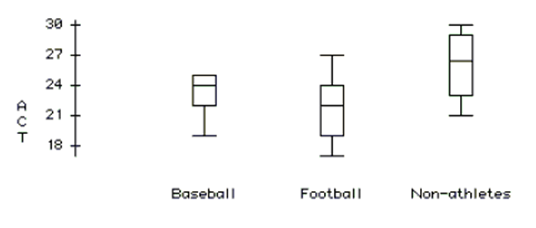
Normal Probability Plot: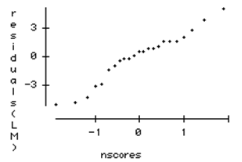
-Test an appropriate hypothesis and state your conclusion
Definitions:
Renzo Piano's Tjibaou Cultural Centre
A landmark of contemporary architecture in Nouméa, New Caledonia, designed by Renzo Piano, which celebrates the culture of the Kanak people.
Architectural Style
The characteristic form and detail of buildings from a particular period, region, or original philosophy.
New Caledonia
A French territory located in the southwest Pacific Ocean, known for its rich biodiversity and unique indigenous Kanak culture.
African American Artist
An artist of African American heritage who may express cultural, social, or personal themes through their work.
Q3: Verify that this scenario satisfies all four
Q11: Homelessness is a problem in many
Q18: The highway speeds of 100 cars
Q41: In a survey, 26 voters were
Q42: Traffic accidents Police reports about the traffic
Q55: Use a significance level of 0.01 to
Q64: Luxury cars According to infoplease, 18.8% of
Q72: The two samples whose statistics are
Q101: Researchers collect data by interviewing athletes who
Q174: A company had 80 employees whose